
Neurogenetics & ADHD
Advances in neuroscience, brain imaging and clinical research indicate ADHD results primarily from a complex interplay of genetics and neurology. In turn, neurogenetics influences brain development, structure, connectivity, and function.
Whilst the exact cause of ADHD has not been identified, according to Barkley (2016) as many as 25-44 genes may be involved in causing ADHD (although not all risk genes need to be present to create ADHD). These genes are not unique to people with ADHD nor do they differ in their entirety. The genes do however differ in form due to their structural make-up. For example, a person with ADHD may have a different version of sequential coding on a gene or an increased number of coding copies resulting in a longer version of the gene. These differences don’t alter the overall gene significantly enough to produce a different gene but enough to result in varied gene expression (Barkley, 2016).
Personal characteristics such as sex, height, hair/skin colour, and blood group are also determined by different forms of the same gene. This is termed polymorphism and is common in nature.
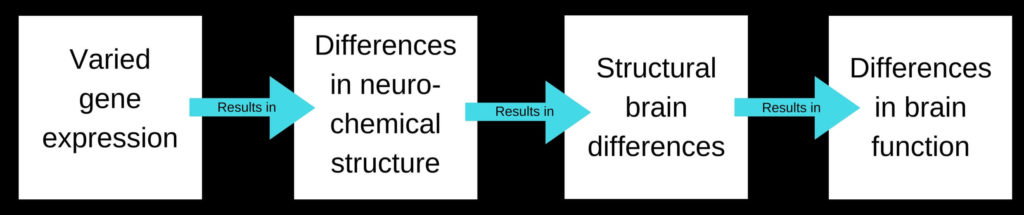
The way a gene expresses itself has a flow on effect: gene expression influences neurochemical (neurotransmitter) structure, which affects brain structure, which affects brain function.
Barkley (2016) explains varied gene expression in individuals with ADHD may alter:
- dopamine and norepinephrine sensitivity
- neurochemical re-uptake into nerve cells
- the way nerve cells migrate and then terminate in various brain regions
- how nerve cells are pruned later in development
- the architecture of a nerve cell.
For example, a nerve cell may have an increased number of re-uptake transporters present at the presynaptic terminal resulting in released neurochemicals being transported back into the synaptic vessels too quickly. In turn, reduced neurochemical availability at the presynaptic terminal may reduce the likelihood of a nerve cell being activated when the membrane of the cell is less sensitive. Failure to activate the nerve cell membrane can interrupt the sending of electrical impulses involved in mental processes.
How ADHD symptoms show up in an individual (i.e. whether a person is more hyperactive-impulsive, more inattentive or more emotionally reactive), as well as how severe their symptoms are, will be 80% dependent upon:
- the number of genes structurally affected
- which genes are structurally effected
- how the resultant structural change effect brain function.
Neurogenetic differences therefore help to explain why ADHD symptom expression and severity can differ between individuals, as well as why response to a particular medication and other treatments can vary.
The ADHDgene Genetic Database can be accessed here.
Socio-environmental factors
“There is no credible evidence to indicate social environment alone can lead to a child developing ADHD” (Barkley, 2015).
Social-environment factors have been shown to influence ADHD gene expression, as well as the degree of ADHD gene expression. Barkley (2015, 2016) explains:
- Adverse social environments (i.e. stress, social adversity, parental/institutional insensitivity or deprivation, physical maltreatment) may increase the likelihood of ADHD gene activation, as well as the degree of ADHD gene expression.
- Benign social environments (i.e. parental warmth, supportive positive parenting) may decrease the likelihood of ADHD gene expression, as well as the degree of ADHD gene expression.
- Maternal smoking during pregnancy can increase a child who carries the ADHD gene’s risk of developing ADHD by 2-3 times.
In addition, some social-environmental factors may affect brain development with or without altered gene expression. Barkley (2015) tells us a small number of ADHD presentations may arise from:
- pregnancy complications i.e. prenatal alcohol and cigarette exposure, difficulties during pregnancy, premature delivery, significantly low birth weight
- injuries to the brain sustained after birth i.e. acquired brain injury to the prefrontal regions of the brain.
Brain regions involved in ADHD
Copious studies looking at specific brain regions have been able to identify brain structure differences in individuals with ADHD. These differences have been found in the:
- prefrontal cortex (part of the cerebrum which is responsible for executive functions i.e. working memory, thinking, planning, organising, problem solving, self-regulation, personality)
- anterior cingulate cortex (involved in reward anticipation, decision making, impulse control and emotional regulation)
- frontal section of the corpus callosum (largest white matter structure. It’s role is to communicate between the two hemispheres [sides] of the brain)
- basal ganglia regions including the:
- corpus striatum (involved in reward processing and anticipation, reinforcement, motivation focus, inhibitory control, stimulus-response learning, motor function)
- caudate nucleus (linked to goal directed action)
- putamen (involved in learning and responding to stimuli)
- nucleus accumbens (Involved in reward and motivation)
- right globus pallidus (involved in the regulation of voluntary movement)
- amygdala (involved in emotional regulation and recognising emotional stimuli)
- hippocampus (involved in some forms of memory i.e. the formation of new memories from experienced events, memory for fact, spatial memory).
Some of these differences identified include:
- reduced brain volume
- alterations in white matter
- reductions in grey matter
- decreased metabolic activity and reduced electrical activity
- altered neurochemical biomarkers
- delayed cortical maturation and thinning.
If you would like to learn more about the brain please go here.
Research
Whilst it is impossible to outline all of the research which provides evidence for the genetic and neurobiological causes of ADHD here, below is a snap shot of some of the recent findings.
Evidence validity refers to how credible and trustworthy research evidence is deemed. Evidence validity is influenced by the rigor of study conducted and the number of times the study findings have been replicated.
Meta-analysis is a study methodology which involves systematically combining data from previous studies to develop a single conclusion.
Results from meta-analysis studies provide the highest-level of scientific evidence when they incorporate results of previous systematic reviews and randomised control trials (RCT) to establish findings. Inclusion of systemic reviews and RCT studies (which are ranked second and third highest in the evidence validity hierarchy) is dependent upon stringent set criteria to ensure accuracy and meaningfulness of results.
Reduced brain volume
In their meta-analysis which compared 1713 participants with ADHD to 1529 controls participants from 23 sites, Hoogman et al. (2012) found individuals with ADHD showed reduced brain volume in key brain regions (amygdala, caudate nucleus, putamen, nucleus accumbens, hippocampus) in comparison to neurotypical individuals. Children were found to have larger differences, with these differences reducing with age. These results did not appear to be influenced by the use of psychostimulant medication, symptom scores or presence of comorbid psychiatric disorders.
Alterations in white matter & grey matter
The brain is composed of two main structural parts:
- Grey matter – composed of neurons, glial cells, synapses and capillaries. This is where information processing occurs.
- White matter – composed of bundles of long-range myelinated axon tracts. These tracts connect various grey matter areas to each other and carry nerve impulses between neurons. The myelin insulates the axon, speeding up electrical impulse transmission.
A meta-analysis of 15 studies undertaken by van Ewijk, et al. (2012) comparing Diffusion Tensor Imaging (DTI) findings in patients with ADHD to healthy controls, found individuals with ADHD showed widespread alterations in white matter integrity regardless of age. Most consistently these alterations were found in the right anterior corona radiata, right forceps minor, bilateral internal capsule, and left cerebellum.
A meta-analysis of 11 studies undertaken by Frodl & Skokauskas (2012) of MRI voxel-based morphometry (VBM) and manual tracing studies aimed at identifying brain differences between adults and children with ADHD, as well as between treated and untreated individuals, found:
- Children with ADHD had reduced right globus pallidus and putamen volumes, as well as decreased caudate volumes.
- With treatment and time these changes in the basal ganglia diminish from childhood to adulthood. However, adults with persistent symptoms were found to have reduced anterior cingulate cortex volumes, especially if they have not been treated for ADHD.
Decreased metabolic activity/Reduced electrical activity
Single-photon emission computed tomography (SPECT) studies consistently show children with ADHD have decreased blood flow to the prefrontal regions (particularly the right frontal area), to the pathways connecting the prefrontal regions to the limbic system via the stratum, and to the cerebellum. Gustafsson et al. (2000) noted the degree of blood flow in the right frontal region appears to correlate with behavioural severity and reduced electrical activity.
Altered neurochemical biomarkers
Scassellati et al. (2012) conducted a systematic search and a series of meta-analyses on 210 studies examining neurochemical biomarkers associated with ADHD diagnosis. Their results indicated increased levels of norepinephrine (noradrenaline), as well as decreased levels of 3-Methoxy-4- hydroxyphenylethylene glycol, phenylethylamine and monoamine oxidase may be implicated in ADHD presentation.
A small number of studies have indicated that increased or decreased dopamine re-uptake transporter density may contribute to the presence of ADHD. The role of dopamine transporters is to pump unbound dopamine from the nerve synapse back into the nerve cell for storage and later use. High levels of dopamine transporters result in lower concentration levels of dopamine at the synapse. (Dopamine is required for transmitting neural impulses).
It is interesting to note that the Fusar-Poli et al. (2012) study found dopamine transporter density was higher in patients with previous medication exposure and lower in medication-naive patients.
Delayed cortical maturation
Shaw et al. (2006, 2007) conducted a multisite, longitudinal study over a 10-year period using neuroimaging. They compared the age at which individuals with ADHD reach cortical maturation to a control group of typically developing children. Cortical maturation was defined as the point at which peak cortical thickness is achieved. Shaw and his colleagues found that individual’s with ADHD showed marked delay in attaining cortical peak thickness throughout most of the cerebrum. The median age by which 50% of the cortical points attained peak thickness for this group was 10.5 years, which was significantly later than the median age of 7.5 years for the control group. The delay was most prominent in the prefrontal region.
In addition to these findings, Shaw et al. (2013) found the rate of cortical thinning (reduction in cortical thickness) differed between individuals with childhood ADHD depending upon symptom persistence or remission. Specifically, adults who continue to experience significant ADHD symptoms, particularly inattentive symptoms, were found to have more significant cortical thinning (particularly in the medial and dorsolateral prefrontal cortex), whereas adults with no or minimal ADHD symptoms showed no or minimal evidence of cortical thinning.
References
Barkley, R.A. (2010). Deficient emotional self-regulation: a core component of attention-deficit/hyperactivity disorder. Journal of ADHD & Related Disorders, (1), 5–37.
Barkley, R. (2016). Managing ADHD in School: the best evidence-based methods for teachers. Eau Claire: PESI Publishing.
Daley, D., Sonuga-Barke, E., Thompson, M., & Chen, W. (2008). Gene-social environmental interplay in relation to attention deficit hyperactivity disorder. Psychiatry, 7(12), 520-524.
Fusar-Poli, P., Rubia, K., Rossi, G., Sartori, G., & Balottin, U. (2012). Striatal dopamine transporter alterations in ADHD: pathophysiology or adaptation to psychostimulants? A meta-analysis. American Journal of Psychiatry, 169(3), 264-72.
Frodl, T., & Skokauskas, N. (2012). Meta-analysis of structural MRI studies in children and adults with attention deficit hyperactivity disorder indicates treatment effects. Acta Psychiatry Scandinavia, 125(2), 114-26.
Gustafsson, P., Thernlund, G., Ryding, E., Rosen, I., & Cederblad, M. (2000). Associations between cerebral blood-flow measured by single photon emission computed tomography (SPECT), electro-encephalogram (EEG), behaviour symptoms, cognition and neurological soft signs in children with attention-deficit hyperactivity disorder (ADHD). Acta Psychiatry Scandinavia, 89(7), 830-5.
Hoogman, M., et al. (2017). Subcortical brain volume differences in participants with attention deficit hyperactivity disorder in children and adults: a cross-sectional mega-analysis. The Lancet Psychiatry, (4)4, 310 – 319.
Klein, M., Onnink, M., van Donkelaar, M., Wolfers, T., Harich, B., Shi, Y.,, Dammers J., Arias-Va Squez, A., Hoogman, M., & Franke, B. (2017). Brain imaging genetics in ADHD and beyond – Mapping pathways from gene to disorder at different levels of complexity. Neuroscience & Biobehavioral Reviews, 80, 115-155.
Proal, E., Reiss, P.T., Klein, R.G., et al. (2011). Brain gray matter deficits at 33-year follow-up in adults with attention-deficit/hyperactivity disorder established in childhood. Archives of General Psychiatry, 68, 1122-1134.
Scassellati, C., Bonvicini, C., Faraone, S. V., & Gennarelli, M. (2012). Biomarkers and attention-deficit/hyperactivity disorder: a systematic review and meta-analysis. Journal of American Academy of Child and Adolescent Psychiatry, 38, 1003-1019.
Shaw, P., Eckstrand, K., Sharp, W., Blumenthal, J., Lerch, J., Greenstein D., et at. (2007). Attention Deficit/Hyperactivity Disorder is characterized by a delay in cortical maturation. Proceedings of the National Academy of Sciences USA, 104, 19649-19654.
Shaw, P., Lerch, J., Greenstein, D., Sharp, W., Clasen, L., Evans, A., et at. (2006). Longitudinal mapping of cortical thickness and clinical outcome in children and adolescents with attention deficit/hyperactivity disorder. Archives of General Psychiatry, 63(5), 540-549.
Shaw, P., Malek, M., Watson, B., Greenstein, D., de Rossi, P., & Sharp, W. (2013). Trajectories of Cerebral Cortical Development in Childhood and Adolescence and Adult Attention-Deficit/Hyperactivity Disorder. Biological Psychiatry, 74(8), 599-606.
van Ewijk, H., Heslenfeld, D.J., Zwiers, M.P., Buitelaar, J.K., & Oosterlaan, J. (2012). Diffusion tensor imaging in attention deficit/hyperactivity disorder: a systematic review and meta-analysis. Neuroscience & Biobehavioral Reviews, 36(4), 1093-106.